The VERMEER Rodenticides tool is integrated in the MERLIN-Expo platform. All the potential features of the MERLIN-Expo platform are described in detail on MERLIN-Expo official site.
Model Selection
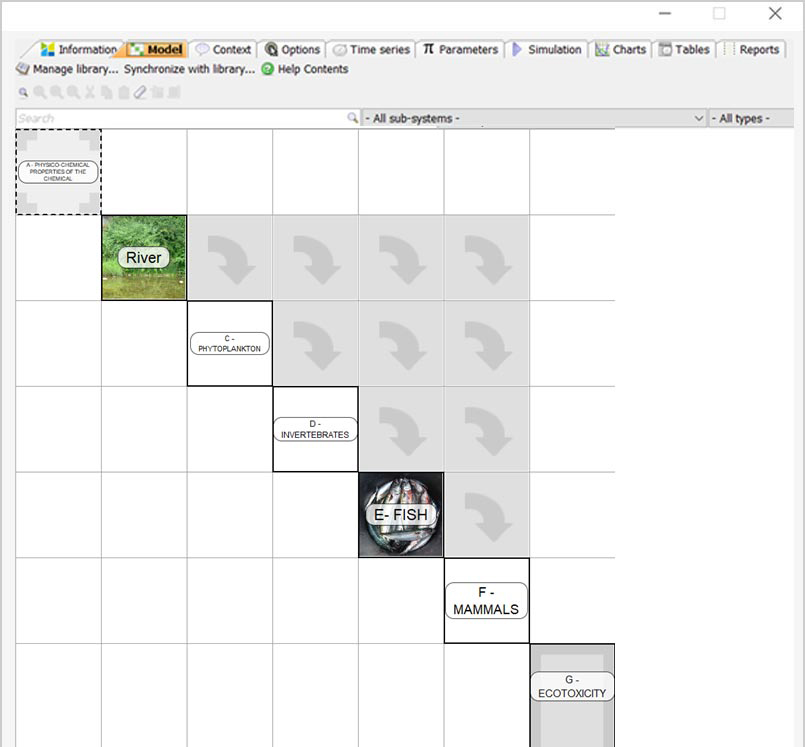
The comprehensive VERMEER Rodenticides tool is subdivided in six main blocks:
- Block 1: the ‘River model’ block, which simulates the partition of chemicals between water and Suspended Particulate Matter, as well as the concentration of chemicals in bottom sediments;
- Block 2: the ‘Phytoplankton model’ block. The main output of this model is the kinetic evolution of the concentration of chemical in phytoplankton (in mg.kg-1 fw);
- Block 3: the ‘Invertebrates model’ block. The main output of this model is the kinetic evolution of the concentration of chemical in invertebrate species (in mg.kg-1 fw);
- Block 4: the ‘Fish model’ block. The main output of this model is the kinetic evolution of the concentration of chemical in fish species (in mg.kg-1 fw);
- Block 5: the ‘Mammals model’ block. The main output of this model is the kinetic evolution of the concentration of chemical in organs (blood, muscle, liver, kidney, milk) of mammal species (in mg.kg-1 fw).
- Block 6: the ‘Ecotoxicity’ block. It contains QSAR predictions extracted from VEGA of ecotoxicological endpoints for phytoplankton, invertebrates and fish.
Context: Compound and Food Selection
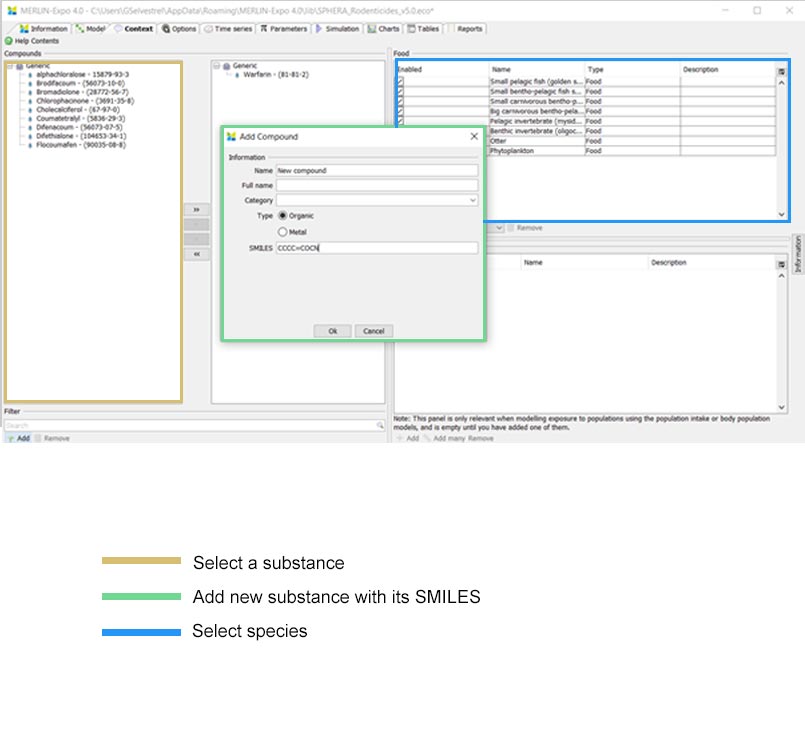
To start the prediction, the compound(s) of interest is selected as well as the species concerned. A list of possible solvents and species are proposed in the VERMEER Rodenticides tool under the ‘context’ tab. Each chemical can be found by its name or ECAS number. In case the chemical of interest is not yet present in the list, it can be added manually. In order to be able to perform the VEGA predictions, SMILES should be inserted as well.
Calculated vs Measured Parameters
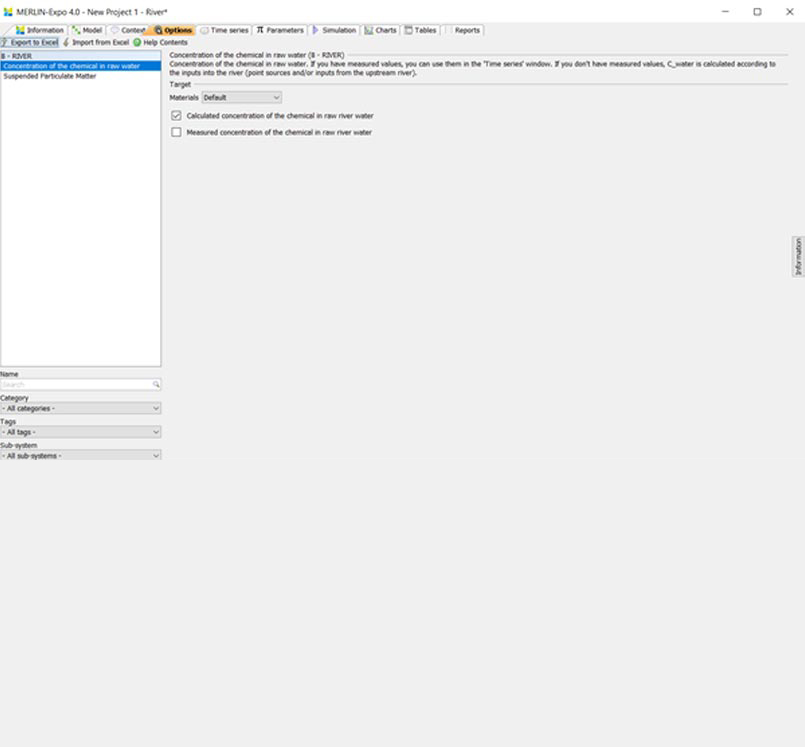
The “Option” tab offers the user the possibility to simulate the assessment either with calculated or measured values for some parameters. By default, “Calculated” parameters is selected and the program will used calculated parameters based on default values. In case “Measured” parameters is selected, the user has to add its own measured values in the ‘Parameters’ tab.
The VERMEER Rodenticides tool can calculate the two following parameters (among many others):
- the Concentration of chemical in raw river water. If you define flux of chemical from point source(s) (in mg.d-1) and/or inputs of chemicals from the upstream river (in mg.d-1), additionally to data related to the river flow rate (in m3.d-1), the River model calculates the concentration of the chemical(s) in raw water;
- the Suspended Particulate Matter concentration. SPM can be calculated by a rating curve relating SPM to river flow rate (see 3.1).
But if you have measured values for one of these parameters, or for both, you can use these measured experimental values instead of calculated values.
Time series
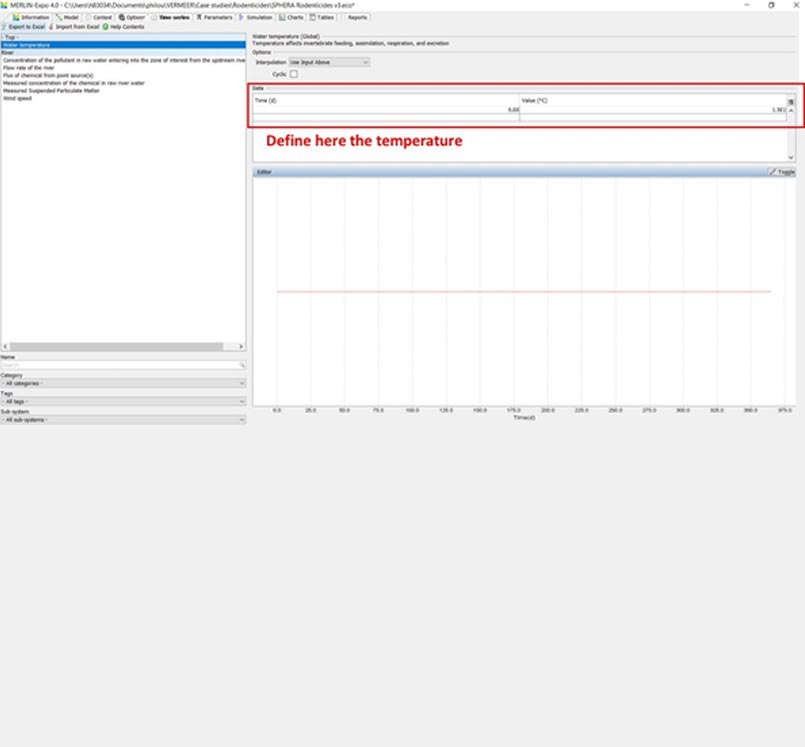
In the ‘Time series’ tab, temperature and other variables need to be defined to create the expected scenario.
Parameters and Hazard Data Predictions
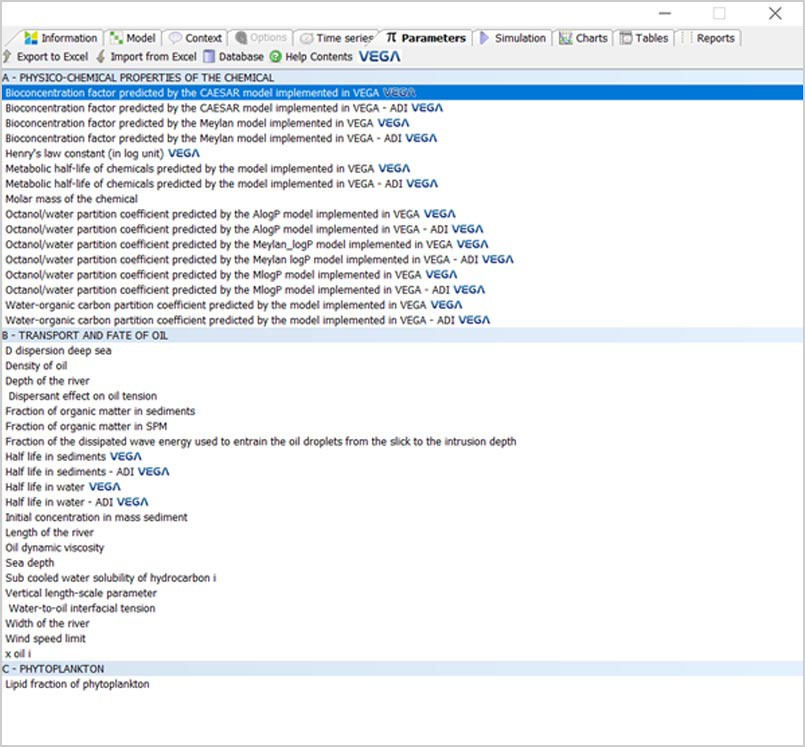
In the ‘Parameters’ tab, additional information on the chemical and the species needs to be provided. For other parameters, indicated by the VEGA tag, predictions can be made by the relevant QSAR model available in VEGA. For each of the hazard-related parameters, two types of models are available: one providing the quantitative or qualitative value of the prediction and another one related to the Applicability Domain Index (ADI) or consensus score associated with the prediction.
Simulation tab
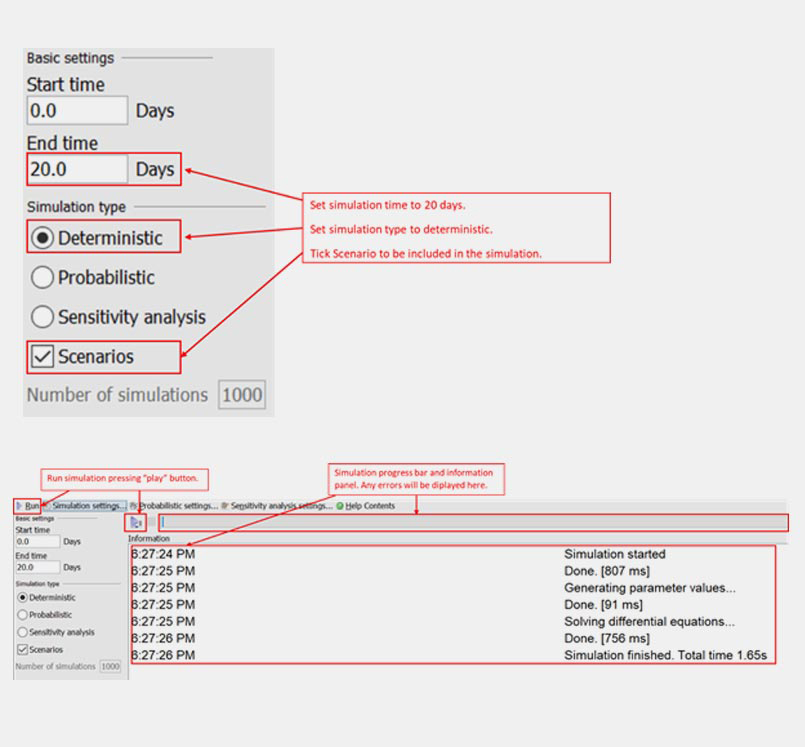
Simulation setting are entered in the Basic settings panel. More advance options can be accessed using Simulation settings dialog box. This can be used to change simulation time step, time scale, and select output of interest. Here all endpoints from all models will be produced.
Results
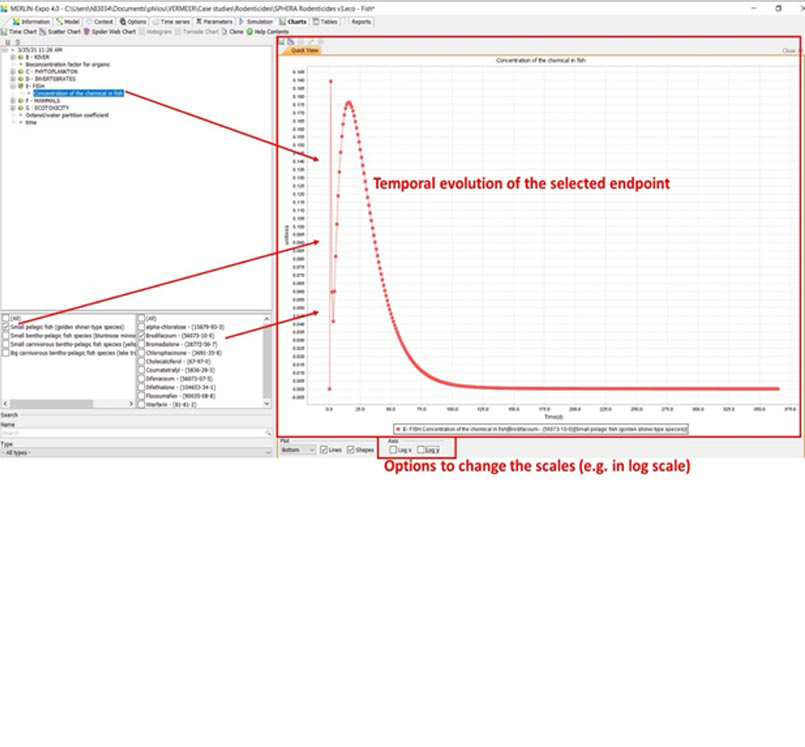
After running the simulation, the VERMEER Rodenticides tool generates figures and tables to visualize the results in the tab “Graphs” and “Tables”.
The user can export all the output data of the simulation and hazard prediction to a text or Excel file and a report can be generated.